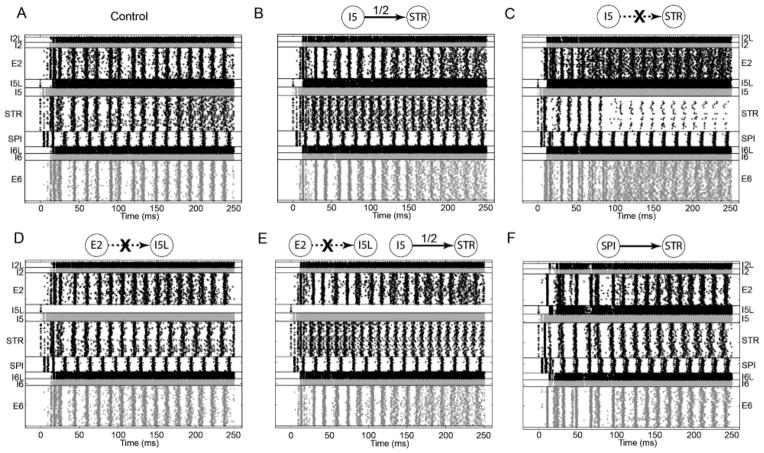
Figure 8.
Rasters showing network activity with 54% L5A activation where I5→STR connection is left intact (A; control), strength is set to half the typical value (B) or the connection is cut (C), where E2→I5L connection alone is cut (D) or it is cut in addition to halving the strength of I5→STR (E) and where a SPI→STR connection is introduced (F).

