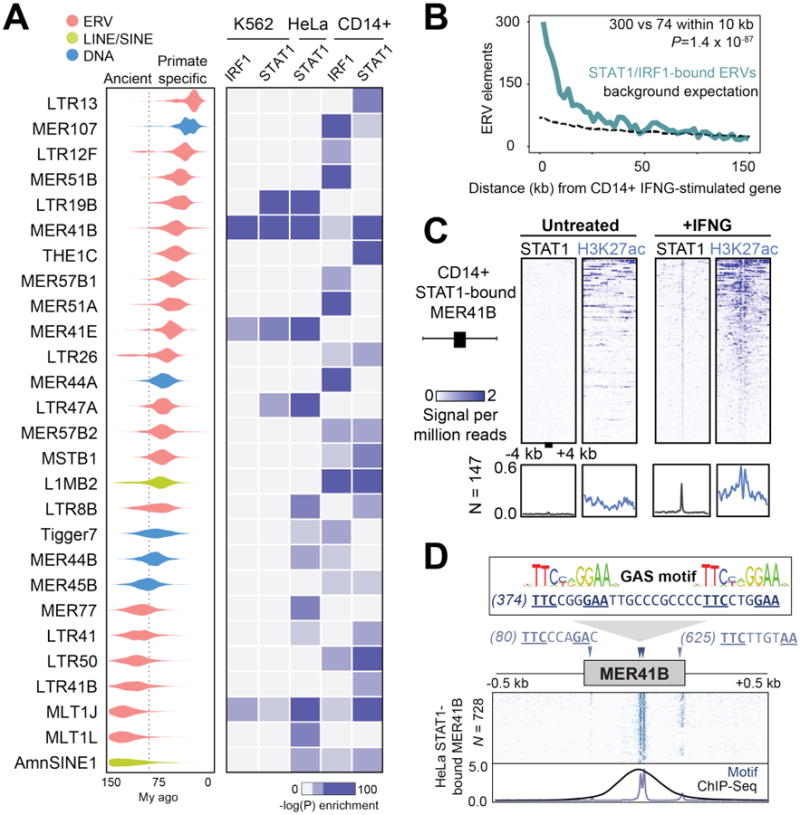
Fig. 1. Dispersion of IFNG-inducible regulatory elements by ERVs.

A) Age distribution (left) and enrichment within ChIP-Seq datasets (right) of 27 TE families that were enriched within binding sites for IFNG-stimulated cells (18). Estimated primate/rodent divergence time (82 My) from (34). B) Frequency histogram of absolute distances from each ERV to the nearest ISG, for CD14+ cells. The background expectation is from the genome-wide ERV distribution (18). Statistical significance of the observed enrichment within the first 10 kb of the nearest ISG assessed by binomial test. C) Heatmap of CD14+ ChIP-Seq signals centered across STAT1 peak summits within MER41B elements. Bottom metaprofiles represent average normalized ChIP signal across bound elements. D) Schematic of the MER41B LTR consensus sequence. Triangles indicate Gamma Activated Site (GAS; TTCNNNGAA) motifs predicted to bind STAT1 in response to IFNG (13). Heatmap depicts the presence of GAS motifs across 728 extant STAT1-bound MER41B copies in HeLa cells (18). Bottom metaprofile represents average presence of STAT1 motifs relative to the MER41 consensus sequence, overlain with normalized STAT1 ChIP-Seq density across the same elements.
