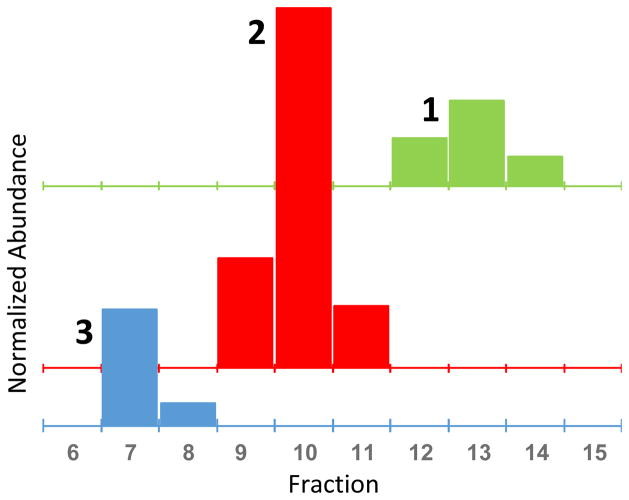
Fig. 3.
Off-line qHNMR analysis of the discrete countercurrent chromatography fractions (x-axis) for the isolation of the three isomers, shown as separate bar graphs for each isolate 1–3. The scale of the Y-axis is arbitrary and normalized to the residual solvent signal of CHCl3. The K values of the analytes 1, 2, and 3 were 2.1, 1.5, and 1.0 respectively, eluted under normal phase conditions. While the discrete sample rate of the qHNMR data points does not allow reconstruction of the Gaussian peak shapes, the lack of detectable amounts of 1 in fractions of 2, of 2 in fractions of 3, and vice versa, demonstrates the baseline separation of all analytes.

