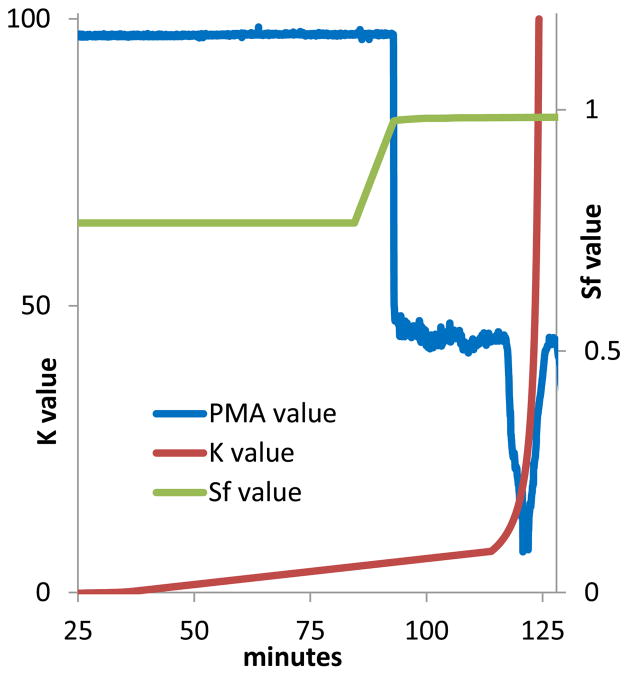
Fig. 4.
An example of CherryOne system operating output. Real time phase monitoring of Sf shows that 0 to 85 min is an equilibrium state with an Sf value of 0.77. At 84 min the extrusion process was initiated by pumping the upper stationary phase that displaced the lower mobile phase in the column without stopping the rotation. Real time measurement of K monitors the gradual increase in partition coefficient values as elution proceeds as well as the precipitous rise in K values during extrusion. Phase metering apparatus (PMA) values show that the original stationary phase is extruded beginning at 93 min. The signal reduction occurring in the phase metering apparatus curve from 115 until 127 min is caused by ionic constituents being extruded in the aqueous phase.

