
FIGURE 3.
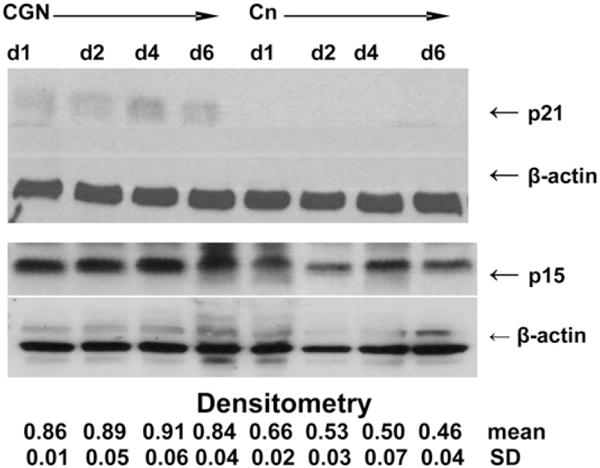
Western blot of p21 and p15 in CGN-exposed vs. control NCM460 cells. Representative Western blots demonstrate relative increases in p21 and in p15 on d 1, 2, 4, and 6. P21 was absent in the control cells on d 1, 2, 4, and 6, in contrast to the CGN-treated cells, indicating an increase in expression following CGN exposure. Densitometric analysis was used to calculate the p15:β-actin ratios that demonstrate significant differences between CGN-treated and control cells (P = 0.005; paired t test, 2-tail, n = 2).