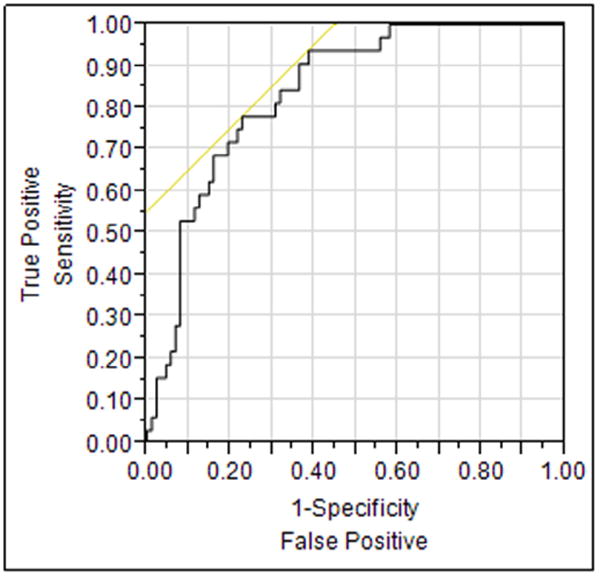
Fig 2.

Parsimonious model receiver operator characteristic curve. Variables included oxygenation at day -2, time from admission, maximum temperature on day 2, and secretion purulence on day -1. The logit model was calculated as 29.9 + Match (“Secretions day -1 (none = 0, nonpurulent =-0.69, purulent =-0.063 – 0.83 × (Maximum temperature day -2”) + 0.000003 × (Days since admission) + 0.009 ×(PaO2/FiO2 day-2”). The area under the curve for this model was 0.83.
