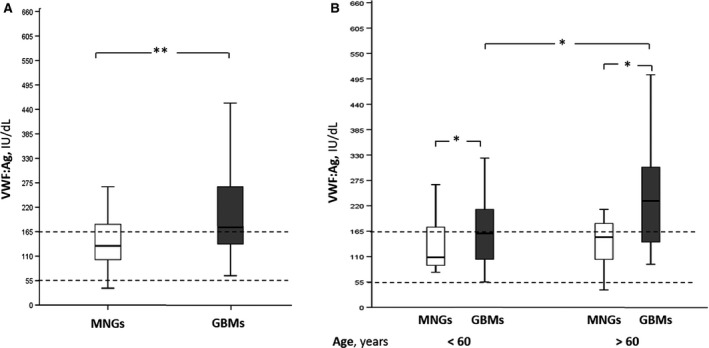
Figure 1.

VWF:Ag plasma levels in MNG and GBM patients. (A) The box‐plots represent the interquartile range with median (central line); the whiskers represent the range of MNGs and GBMs measured in our patient cohort; (B) the box‐plot represent the VWF:Ag levels in MNGs and GBMs above 60 years of age, compared to younger. The dotted lines depict the interquartile ranges (IQR) of (VWF):Ag plasma levels in normal subjects. Mngs, Meningiomas. *P < 0.05; **P < 0.01. GBM, glioblastoma; MNG, meningiomas; VWF, von Willebrand Factor.
