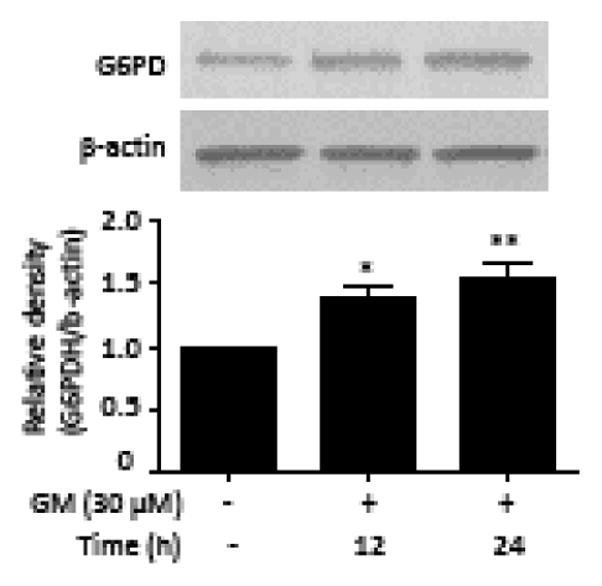
Figure 7. GM up-regulates G6PD expression.

HT-22 cells were exposed to 30 μM GM. Samples were collected at 12, 24 h after GM exposure. Cell extracts were subjected to immunoblot with antibodies specific for G6PD. Quantitation of G6PD was normalized to β-actin. Bars represent normalized relative densities plotted as mean ± SEM calculated from 5 independent blots. *P < 0.05, **P < 0.01 compared with control group (one-way ANOVA, Tukey’s test).
