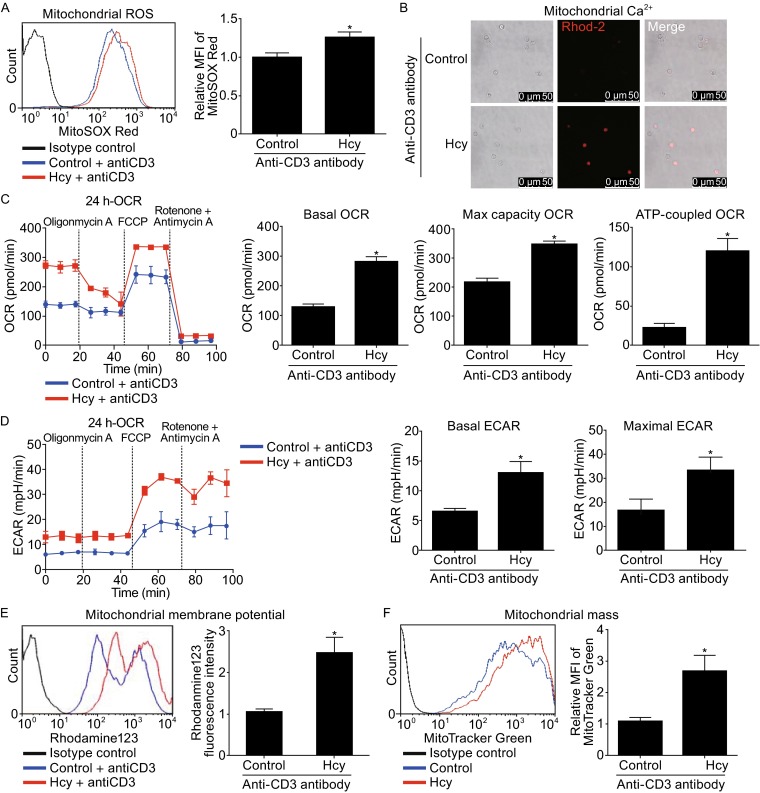
Figure 2.

Altered T-cell mitochondrial metabolism in response to Hcy stimulation. T cells were incubated with or without Hcy (50 μmol/L) in the presence of anti-CD3 antibody for 24 h. (A) Flow cytometry of T cells stained with MitoSOX Red (left), and quantification (right). (B) Confocol images of T cells loaded with Rho-2. (C) Traces of OCR of T cells as measured by the XF24 metabolic analyzer, with additions of mitochondrial effectors at time points indicated (left), and quantification of the basal OCR, max capacity OCR, and ATP-linked OCR (right). (D) Traces of ECAR of T cells as measured by the XF24 metabolic analyzer, and quantification of the basal and maximal ECAR (right). Flow cytometry of T cells stained with rhodamine 123 (E) and MitoTracker Green (F). Data are mean ± SEM from 3 independent experiments. *, P < 0.05 vs. control
