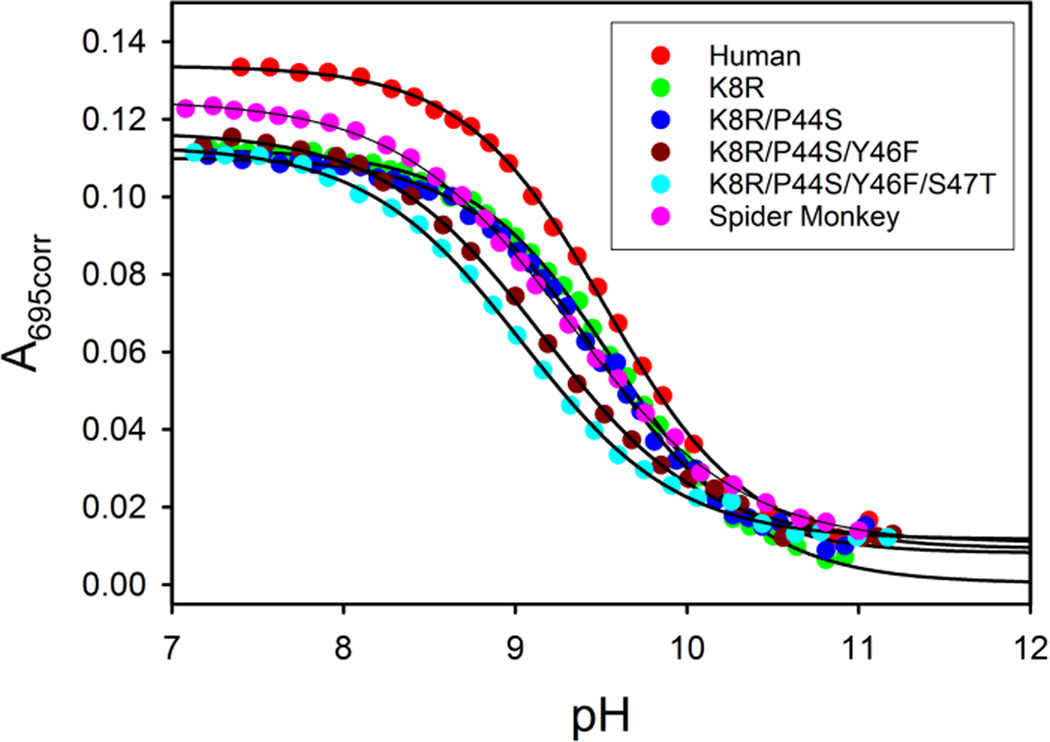
Fig. 2.
Alkaline conformational transition for Hu Cytc, SM Cytc and variants used to convert Hu to SM Cytc. Plots of A695corr versus pH are fit to Eq. (2) in the Experimental (solid curves). Parameters from the fits to Eq. (2) are collected in Table 3. Data were obtained in 100 mM NaCl at ~200 µM protein concentration and at 23 ± 1 °C.

