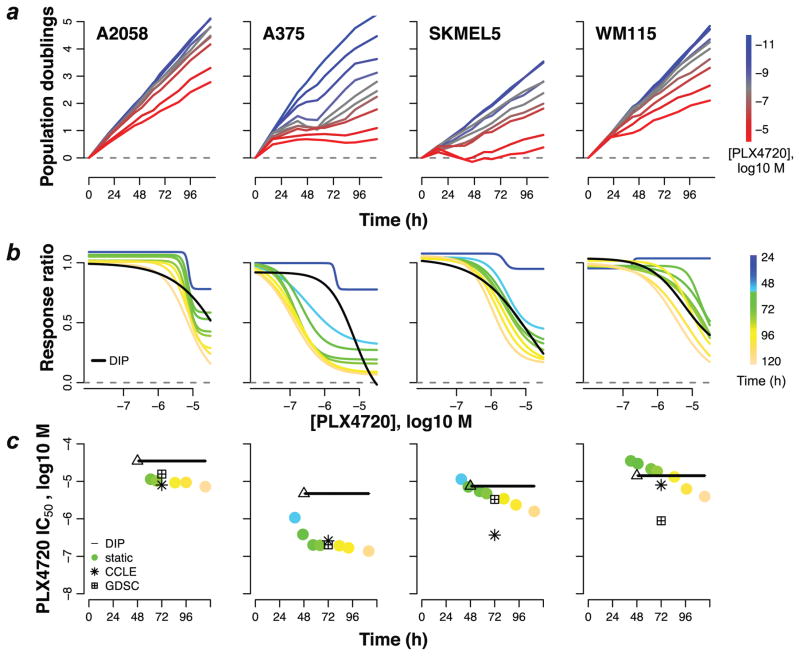
Figure 3. Bias in potency metrics from publicly available data sets.
(a) Population growth curves (log2 scaled) for four select BRAF-mutant melanoma cell lines treated with various concentrations of the BRAF inhibitor PLX4720; (b) dose–response curves based on the static effect metric (colored lines) and DIP rate (black line); (c) static- (circles) and DIP rate-based (triangle+line) estimates of IC50 for each measurement time point. IC50 values obtained from public data sets (CCLE: Cancer Cell Line Encyclopedia; GDSC: Genomics of Drug Sensitivity in Cancer), based on the static 72h drug effect metric, are included for comparison. The triangle denotes the first time point used in calculating the DIP rate and the black line signifies that the value remains constant for all subsequent time points. Data shown are from a single experiment with technical duplicates. Experiment has been repeated at least twice with similar results.

