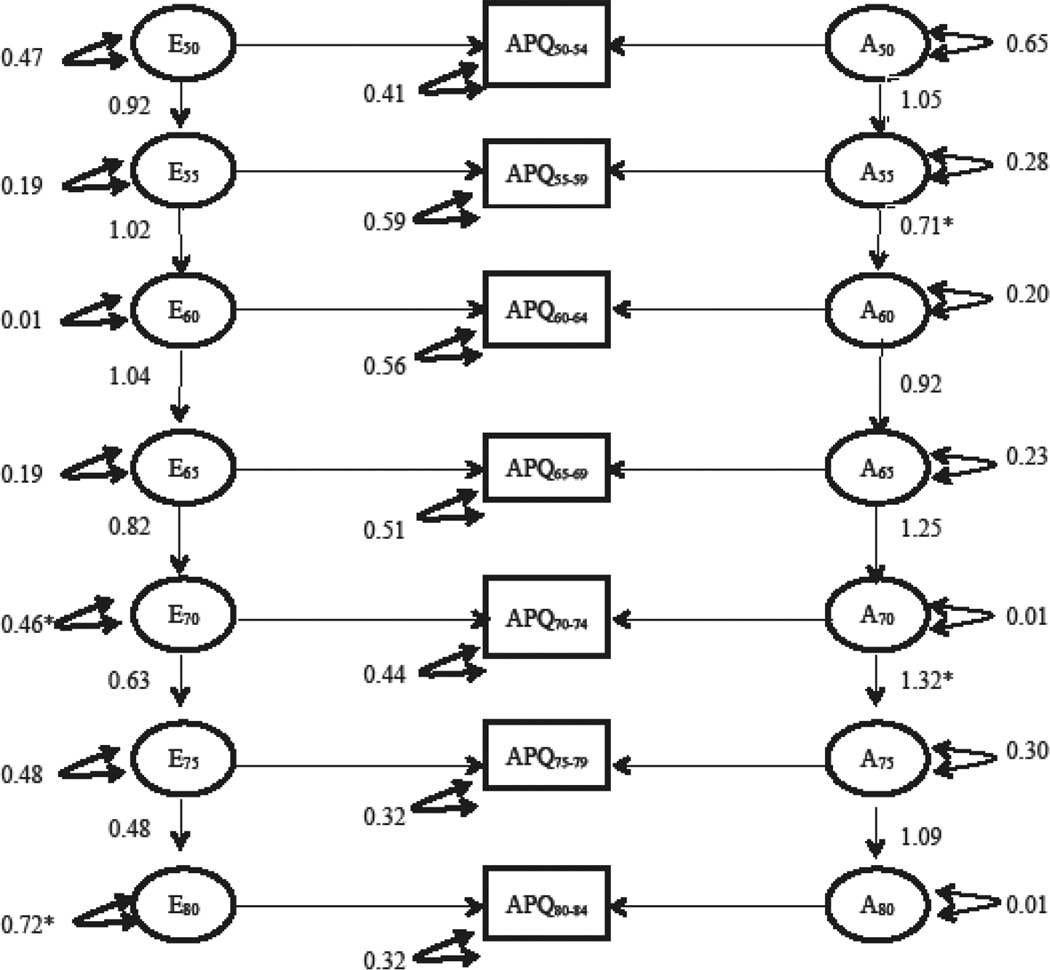
Figure 4.
Depiction of parameter estimates from the full AE APQ simplex model A = additive genetic effects; E = unique environmental effects; APQ= APQ for each age bucket; single headed arrows=path coefficients; double headed arrow = variance components; * represents a significant decrease in model fit when parameter is dropped/constrained to 1.0

