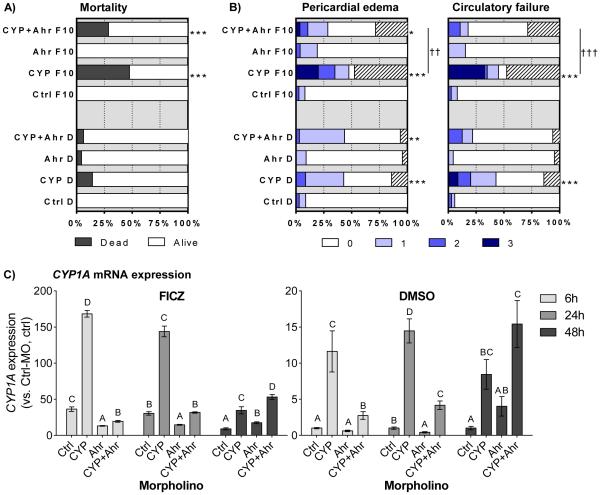
Figure 4. Role of Ahr2 in FICZ-mediated effects.
Groups of embryos injected with Ctrl-MO (Ctrl), CYP1A-MO (CYP), Ahr2-MO (Ahr), or a combination of CYP1A-MO and AHR2-MO (CYP+Ahr), were exposed to vehicle control (DMSO; D) or 10 nM FICZ (F10). Exposure vessels were randomized in order to avoid subjective scoring of the different morpholino groups. At 48 hpt, rates of A) cumulative mortality and B) pericardial edema (PE) and circulatory failure (CF) were determined. Severity of PE and CF was scored as shown in Fig. 1D. In B) the hatched part of a bar indicates the mortality rate. Relative levels of CYP1A mRNA expression were determined at 6, 24, and 48 hpt (C). All data were normalized to il13 as housekeeping gene and calibrated to DMSO-exposed Ctrl-MO embryos at respective time-point. Data in A) and B) are shown as % of total number of embryos at exposure start based on three separate experiments (n=75-90). Statistically significant differences between the Ctrl-MO injected groups and the CYP1A-MO, Ahr2-MO, or CYP1A+Ahr2-MO injected groups were determined by Fisher's exact test with Bonferroni's correction and are shown by asterisks (*p<0.05, ** p<0.01 and *** p<0.001). Daggers designate differences between indicated bars (†† p<0.01 and ††† p<0.001). For the statistical analysis “affected embryos” are represent by the pooled number of all living embryos with severity score 1-3 in a group. Results for CYP1A expression are from 2 or 3 replicate experiments (n= 5-7) and are shown as mean ± SEM. Transcript levels are calculated using l13 as a reference gene and the DMSO-exposed Ctrl-MO groups at each time-point as calibrators. Statistical differences among groups were determined by One-way ANOVA followed by Tukey’s post-hoc test and are indicated by different letters (p<0.05).

