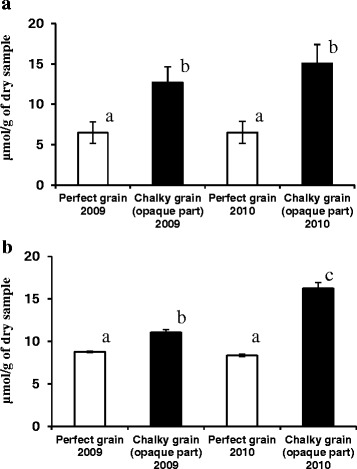
Fig. 6.

Soluble starch with glucose (a) and sucrose (b) contents in the perfect and chalky (opaque part) grains harvested in 2009 and 2010. Values are represented as mean ± s.d. (n = 6–12). Histograms with the same letter do not differ significantly (p ≤0.05)
