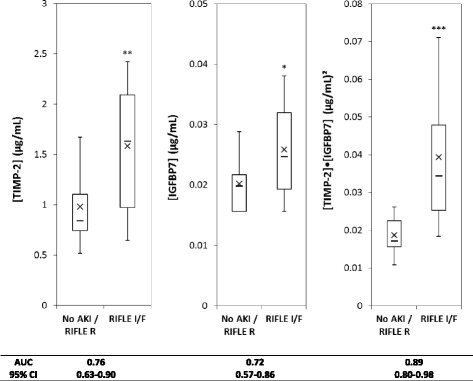
Fig. 1.

Urinary [TIMP-2], [IGFPB7], or [TIMP-2]·[IGFPB7] levels from animals with no AKI (or only RIFLE R) (n = 18) compared to RIFLE I or F (n = 30). Box and whiskers show interquartile range and 5th to 95th percentiles, respectively. Horizontal dash shows the median, and X shows the mean. *P = 0.01, **P = 0.002, ***P < 0.001
