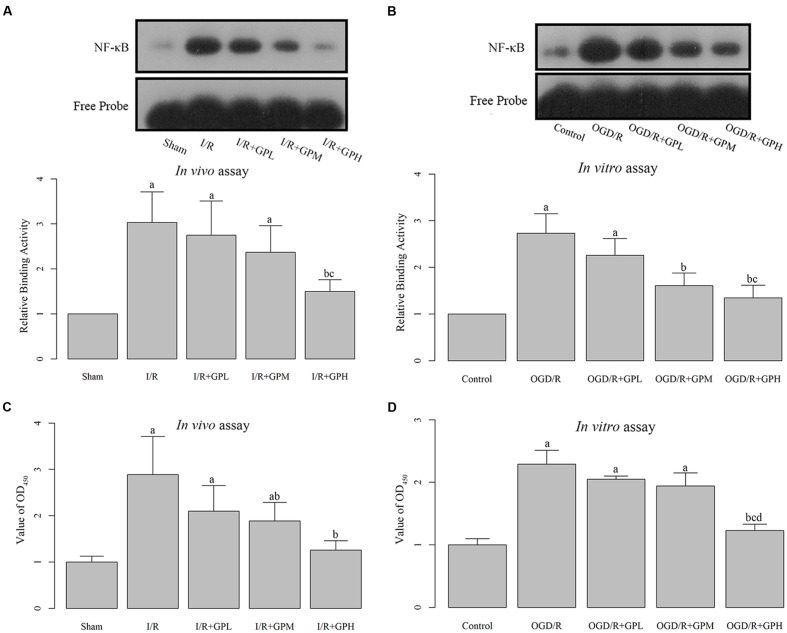
FIGURE 3.
Treatment with GP significantly inhibited the production and nuclear translocation of NF-κB. (A) The graph represented the relative NF-κB binding activity, and the image represented the EMSA results in I/R injured rats. (B) The graph represented the relative NF-κB binding activity, and the image represented the EMSA results in OGD/R H9c2 cells. (C) The NF-κB activity was analyzed using a NF-κB p65 ELISA Kit, and value of OD450 represented the activity of NF-κB p65 in I/R injured rats. (D) The NF-κB activity was analyzed using a NF-κB p65 ELISA Kit, and value of OD450 represented the activity of NF-κB p65 in OGD/R H9c2 cells. a, significantly different from sham or Control group, P < 0.05. b, significantly different from I/R or OGD/R group, P < 0.05. c, significantly different from sham group I/R + GPL or OGD/R + GPL group, P < 0.05. d, significantly different from OGD/R + GPM group, P < 0.05.

