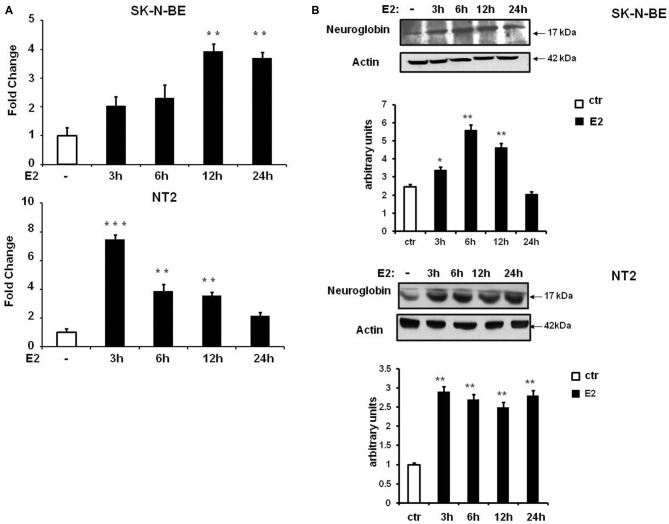
Figure 3.
NGB mRNA and protein expression in SK-N-BE and NT-2 differentiated neuroblastoma cells. (A) Time-course of NGB mRNA after 10 nM 17β-estradiol (E2) treatment. Error bars are ± SEM of three independent biological replicates: *p-value < 0.05, **p-value < 0.01 and ***p-value < 0.001. The p-values were calculated with one-way analysis of variance (ANOVA) followed by Bonferroni post hoc test. (B) Time-course of NGB protein after 10 nM E2 treatment. In all cases diagram shows the mean normalized densitometry values.

