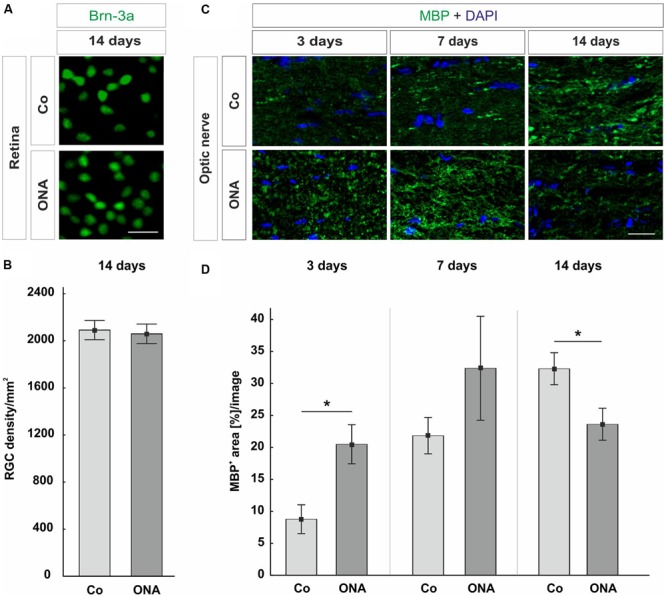
FIGURE 1.

(A) Representative photos of Brn-3a stained flatmounts of the ONA and control group (Co). Both groups showed a similar number of Brn-3a+ cells. (B) The RGC counts revealed no difference between the two groups (p = 0.9). (C) Optic nerve sections labeled with MBP (green) at 3, 7, and 14 days. Cell nuclei were visualized with DAPI (blue). (D) At 3 days, a significant larger MBP+ area was measured in the ONA group compared to Co (p = 0.02). After 7 days, the expression of MBP went back to control level (p > 0.05). A significant decrease in the MBP+ area was observed in the ONA group at 14 days (p = 0.03). Values are mean ± SEM. Scale bars: 20 μm.
