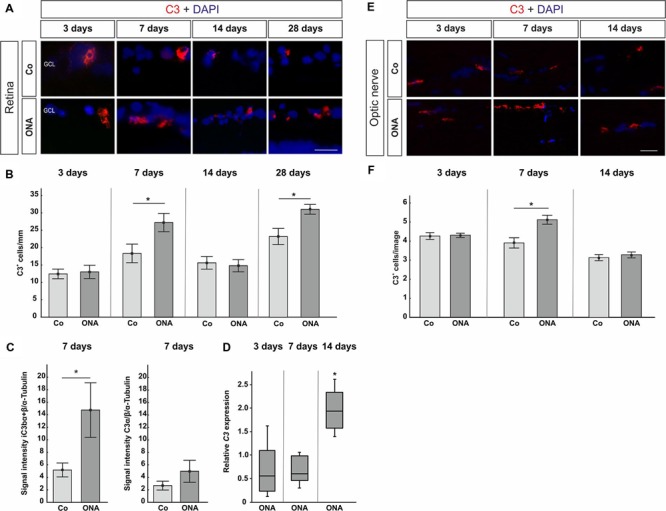
FIGURE 2.

(A) Exemplary photos of C3 (red) and DAPI (blue) labeled retinas 3, 7, 14, and 28 days after immunization. (B) At 3 days, no difference in the number of C3+ cells could be detected (p > 0.05). Significantly more C3 depositions were noted in the ONA group after 7 days (p = 0.002). At 14 days, no difference was observed (p > 0.05). Significantly more C3 depositions were noted in the ONA group 28 days after immunization (p = 0.003). (C) Protein levels of iC3bα+β and C3α at 7 days analyzed via Western Blot. In the ONA group, significantly more iC3bα+β was observed (p = 0.049). The C3α chains were not altered (p > 0.05). (D) Expression levels of C3 at 3, 7, and 14 days measured with qRT-PCR. After 3 and 7 days, no changes in C3 expression could be noted (p > 0.05). The quantification of C3 revealed a significant upregulation in the ONA group at 14 days (p = 0.011). (E) To evaluate C3 in the optic nerve, sections were stained with C3 (red) and DAPI (blue) 3, 7, and 14 days after immunization. (F) No alterations in C3+ cells were noted after 3 days (p > 0.05). At 7 days, significantly more C3+ cells could be observed in ONA optic nerves (p = 0.02). After 14 days, the number of C3+ cells was not altered anymore (p > 0.05). Abbreviations: GCL, ganglion cell layer. Values for immunostaining and Western Blot are mean ± SEM. Values for qRT-PCR are median ± quartile ± maximum/minimum. Scale bars: 20 μm.
