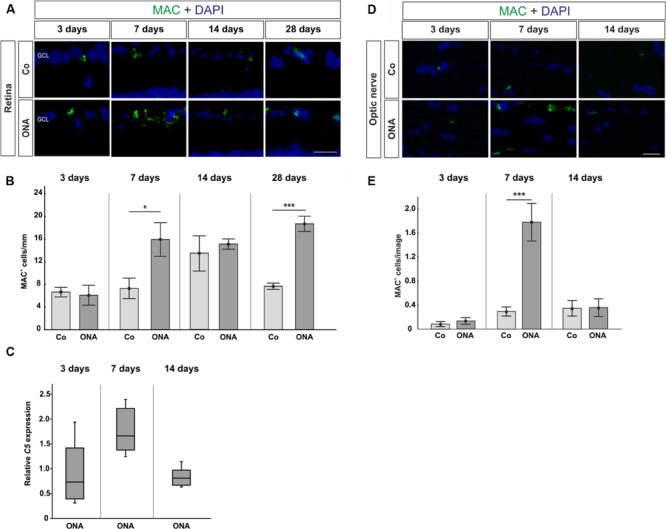
FIGURE 3.

(A) Retinas were labeled with MAC (green) and DAPI (blue) and MAC+ cells were counted in the retina at all points in time. (B) After 3 days, no difference in the number of MAC+ cells could be noted (p > 0.05). At 7 days, the number of MAC+ cells in the ONA group was significantly increased (p = 0.03). At 14 days, no changes were noted (p > 0.05), while at 28 days again significantly more MAC depositions were observed in the ONA group (p = 0.003). (C) Quantitative RT-PCR analysis revealed no differences in C5 expression, which is part of the MAC complex (p > 0.05). (D) Sections of the optic nerves were stained with MAC (green) and DAPI (blue) at all points in time. (E) Three days after immunization, no alterations in MAC depositions could be noted (p > 0.05). A significant increase of MAC+ cells was observed in ONA optic nerves at 7 days (p = 0.001). After 14 days, no changes in the number of MAC+ cells were noted anymore (p > 0.05). Values for immunostaining are mean ± SEM. Values for qRT-PCR are median ± quartile ± maximum/minimum. Abbreviations: GCL, ganglion cell layer. Scale bars: 20 μm.
