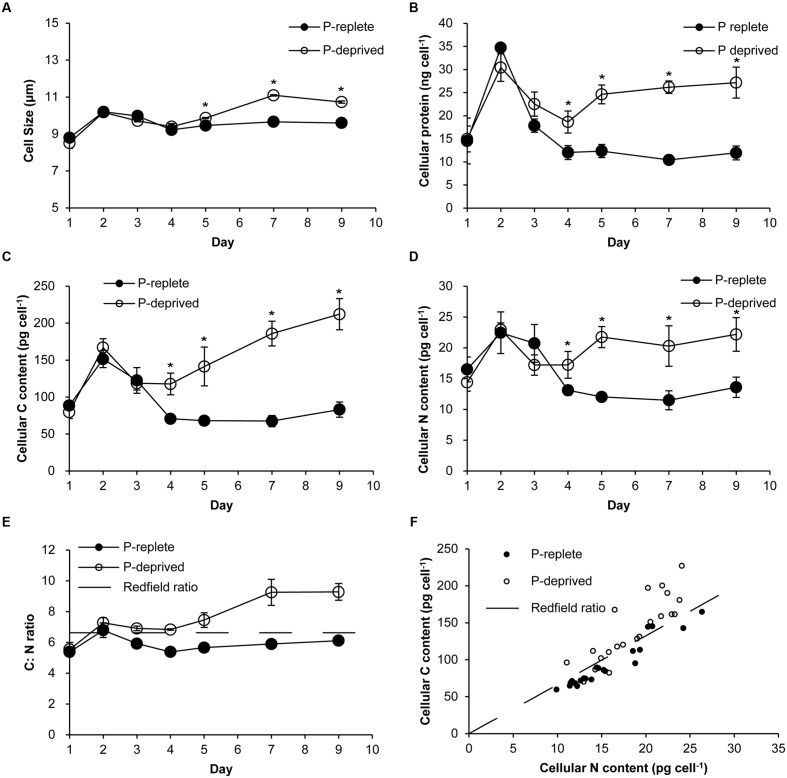
FIGURE 2.
Cellular parameters of A. carterae grown under the P-replete and P-deprived conditions. (A) cell sizes; (B) cellular protein content; (C) cellular carbon content; (D) cellular nitrogen content; (E) cellular C: N ratio; the dashed line depicts Redfield C: N ratio; (F) correlation between carbon and nitrogen contents; the dashed line depicts Redfield C: N ratio. Except in (F), data shown are means ± standard deviations (error bars) from the triplicated cultures. Asterisks represent that significant differences between P-replete and P-deprived conditions were detected (p < 0.05).

