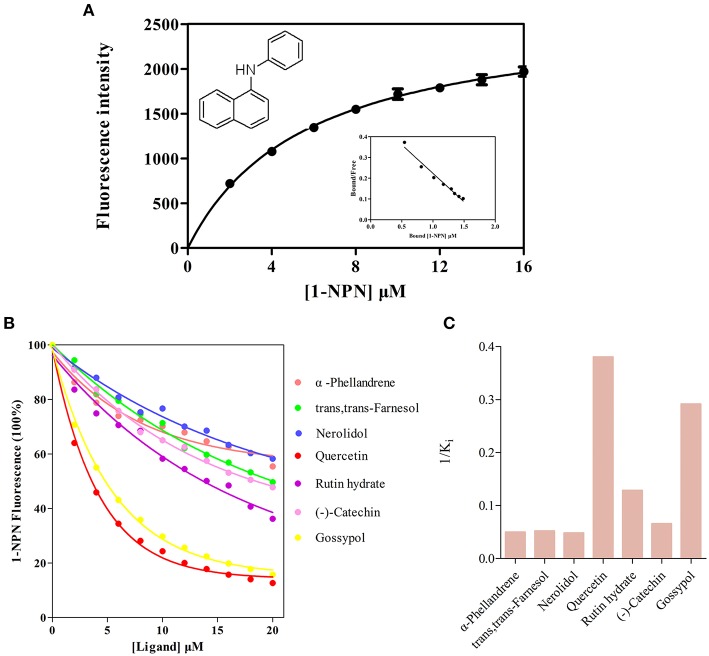
Figure 4.
Fluorescence competitive binding assay. (A) Binding curve and relative Scatchard plot of 1-NPN to AlinOBP11. The dissociation constant of the AlinOBP11/1-NPN complex was calculated as 5.86 ± 0.47 μM. (B) Competitive binding curves of selected host plant compounds to AlinOBP11. (C) The reverse values of the dissociation constants (Ki) measured with putative ligands of AlinOBP11. A mixture of the recombinant AlinOBP11 protein and N-phenyl-1-naphthylamine (1-NPN) in 50 mM Tris-Hcl buffer (pH 7.4) both at the concentration of 2 μM was titrated with 1 mM solutions of each competing ligand to the final concentration range of 2 to 30 μM. Fluorescence intensities are reported as percent of the values in the absence of competitor. Data are represented as means of three independent experiments.

