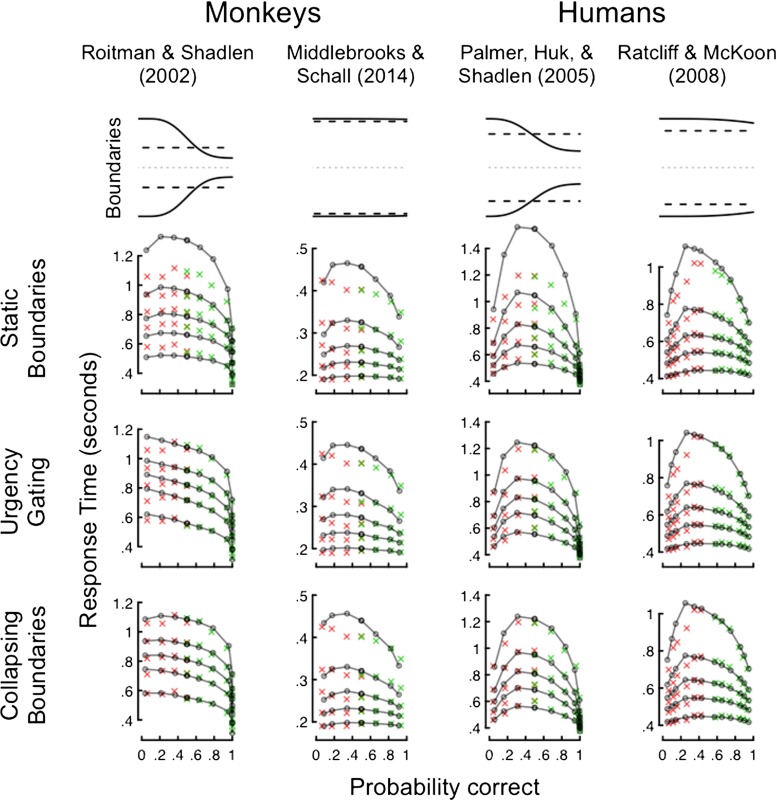
Fig. 2.
DDMs with static and dynamic decision criteria fitted to four data sets (subset of results reported in Forstmann, et al., 2015). Column names cite the original data source, where example data sets from non-human primates and humans are shown in the left two and right two columns, respectively. The upper row shows the averaged estimated collapsing (solid lines) and static (dashed lines) thresholds across participants. The second, third and fourth rows display the fit of the static thresholds, urgency gating, and collapsing thresholds models to data, respectively. The y-axes represent response time and x-axes represent probability of a correct choice. Green and red crosses indicate correct and error responses, respectively, and black lines represent model predictions. Vertical position of the crosses indicate the 10th, 30th, 50th, 70th, and 90th percentiles of the response time distribution. When the estimated collapsing and static thresholds markedly differed (first and third columns), the DDMs with dynamic decision criteria provided a better fit to data than the DDM with static criteria. When the collapsing thresholds were similar to the static thresholds (second and fourth columns), the predictions of the static and dynamic DDMs were highly similar, which indicates the extra complexity of the dynamic DDMs was not warranted in those data sets. For full details see Hawkins, Forstmann, et al., 2015

