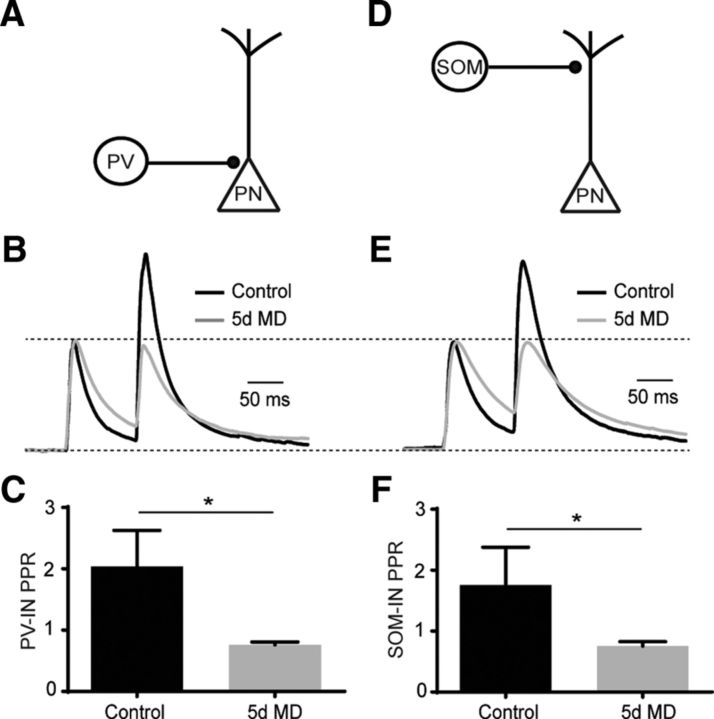
Figure 4.
MD increases presynaptic GABA release from PV-INs and SOM-INs. A, Schematic of optogenetic stimulation of ChR2-expressing PV-INs. B, Average, normalized traces of evoked IPSC recordings after paired, optogenetic stimulation of PV-INs in control (black) and 5 d MD (gray). C, Mean (±SEM) PPR of optically evoked responses for control (black) and 5 d MD (gray) conditions. *p < 0.05. D, Schematic of optogenetic stimulation of ChR2-expressing SOM-INs. E, Average, normalized traces of evoked IPSC recordings after paired, optogenetic stimulation of SOM-INs in control (black) and 5 d MD (gray). F, Mean (±SEM) PPR of optically evoked responses for control (black) and 5 d MD (gray) conditions. *p < 0.05.

