
Figure 1.
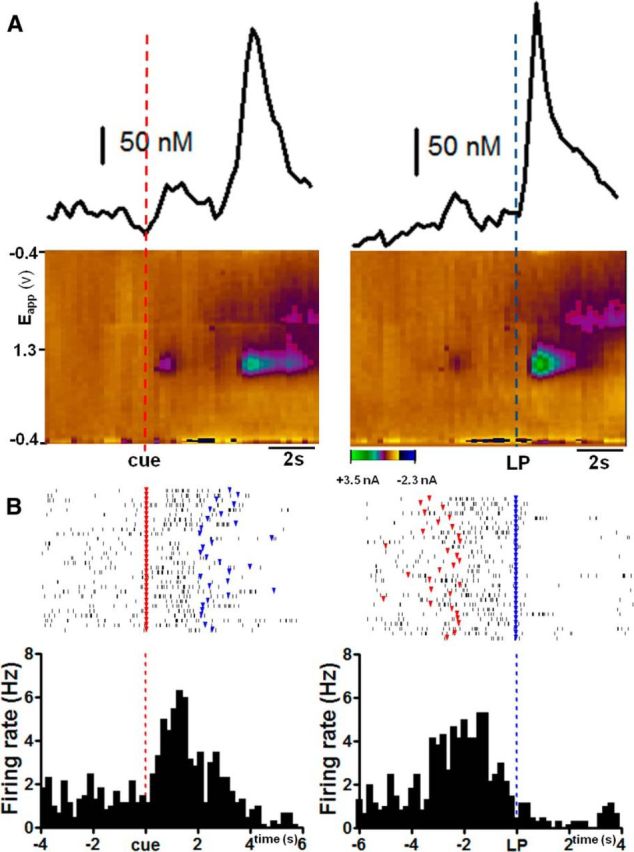
Dopamine response and single-unit events in the NAc during ICSS from a single anatomical location. A, Average dopamine concentration measured during 30 LPs in a single representative experiment. Left, Traces aligned to the cue (red line). Right, Same traces but aligned to LP (blue line). Corresponding set of cyclic voltammograms are given in the 2D color plots that show data collected for a 10 s period before and after the cue or LP. y-axis: applied voltage (Eapp); x-axis: time (s), current is shown in false color. B, Raster plots of single-unit activity and histograms recorded at the same site in a single representative experiment. Left, Rasters aligned to the cue (red symbols). Right, Same traces aligned to LP (blue symbols).