
Figure 2.
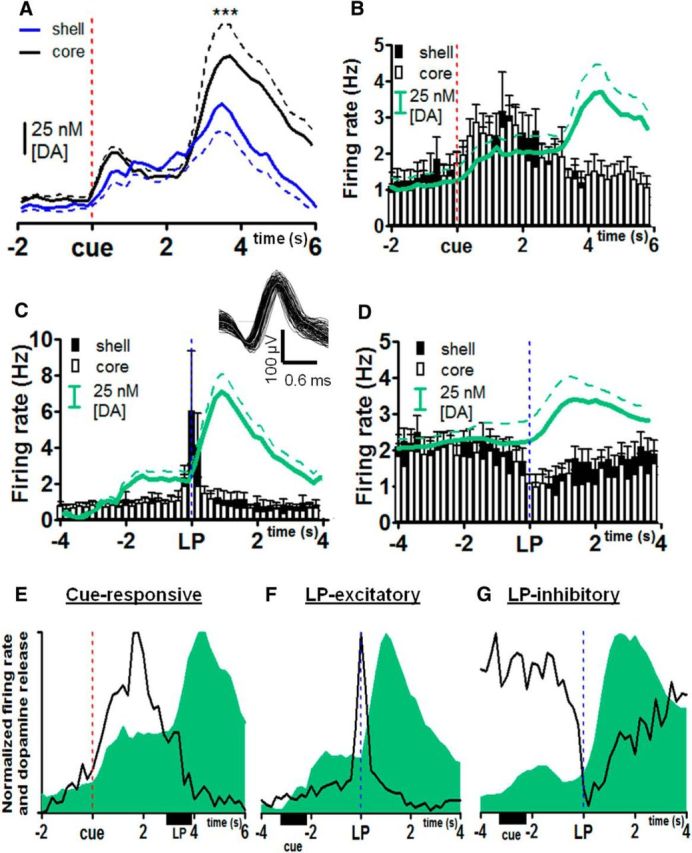
MSN cell-firing patterns and dopamine traces in the core and shell. A, Averaged dopamine concentration responses in the shell (n = 33 locations) and core (n = 20 locations), ***p < 0.001. B, Histograms of firing responses of cue-responsive cells in core (n = 5) and shell (n = 6). C, Histograms from LP-excitatory cells sorted by region, core (n = 10), and shell (n = 15). Inset: Single MSN waveform during ICSS. D, Histograms from LP-inhibitory cells in core (n = 13) and shell (n = 18). In B–D, the average dopamine concentration at the sites where the cells were recorded is shown in green. E–G, Timing relationship between cell-firing rate (black lines) and dopamine release (green shaded) for cue-responsive, LP-excitatory, and LP-inhibitory cell types, respectively. Responses are scaled so that they show the change from minimum to maximum for dopamine and firing rate shown in E and F, whereas the opposite is true for the firing rate shown in G.