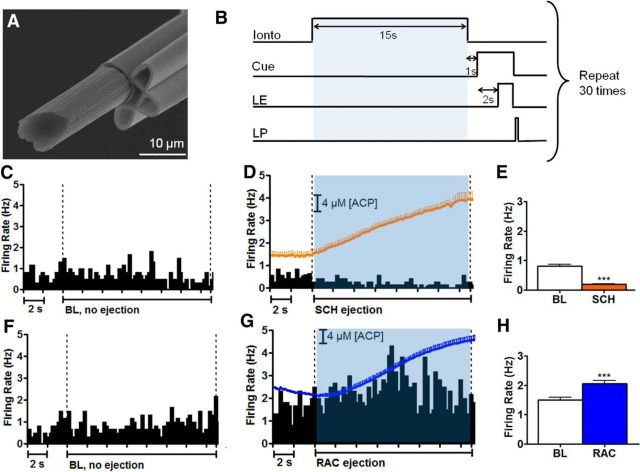
Figure 3.
Multimodal sensor and controlled iontophoresis. A, Electron micrograph of a multimodal sensor with three iontophoretic barrels and carbon-fiber electrode. B, Timing diagram of the iontophoresis injection period and subsequent ICSS behavioral paradigm. Each trial (n = 30) consists of a 15 s ejection period (BL if no drugs were ejected, denoted by the blue shaded region) that ends 1 s before cue onset. The lever is extended (LE) 2 s after cue onset and remains available for 15 s or until the rat presses the lever, whichever occurs first. C, Histogram showing single-unit activity of a representative cell before iontophoretic drug ejection (averaged over 30 trials). Vertical dashed lines indicate beginning and ending of the BL collection period. D, Single-unit activity of the same cell during iontophoretic ejection of SCH (with ACP) at the same location (averaged over 30 ejections). The orange line shows the average local ACP concentration during the 30 ejections. E, Average firing rates of the D1 cell shown in C and D during the period (indicated by dashed lines) before (BL) and during ejections (***p < 0.001). F, Single-unit activity of another representative cell before iontophoretic drug ejection (averaged over 30 trials). G, Single-unit activity of the same cell shown in F during iontophoretic ejection of RAC (with ACP) at the same location (averaged over 30 ejections). Ejected drug concentration monitored by ACP current (blue line, average of 30 ejections). H, Average firing rates for the D2 cell shown in F and G during the period (indicated by dashed lines) before (BL) and during ejections. ***p < 0.001.

