
Figure 4.
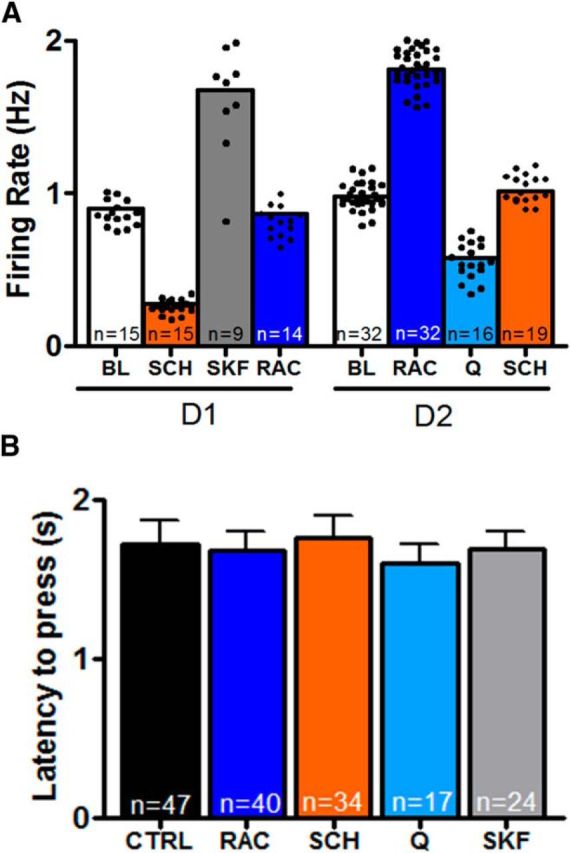
Receptor identification via the multimodal sensor. A, Average firing rates recorded during 15 s periods before (BL) or during iontophoretic ejection of SCH or RAC during the ITI for all cells. Cell firing changes during iontophoresis relative to BL were used to determine D1R or D2R chemotype. Cell-firing changes to the agonists Q and SKF were used to verify the sorting into D1-responsive MSNs (n = 15) and D2-responsive MSNs (n = 32s). N in the column refers to how many locations in which each drug was tested; the barrels contained the two antagonist (SCH and RAC) and one agonist (either SKF or Q). Dots show the individual responses to each drug. B, Latency to LP after lever extension in the presence of iontophoresed drugs (CTRL without iontophoresed drug, n = 47; RAC, n = 40; SCH, n = 34; Q, n = 17; SKF, n = 24).