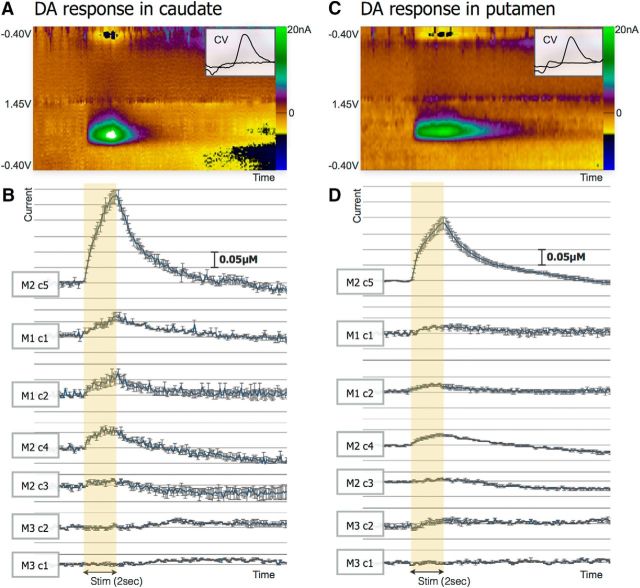
Figure 2.
DBS-evoked dopamine (DA) response. A, Representative pseudocolor plot of STN stimulation-evoked change in caudate DA as analyzed by voltammetry. B, Mean ± SEM DA oxidation current versus time plot of stimulation-evoked DA release in the caudate relative to a single subject and a single contact as marked in the left panel (average of n = 3 data points). C, Representative pseudocolor plot of STN stimulation-evoked change in DA putamen as measured by voltammetry. D, Mean ± SEM DA oxidation current versus time plot of stimulation-evoked DA release in the putamen relative to a single subject and a single contact as marked in the left panel (average of n = 3 data points).

