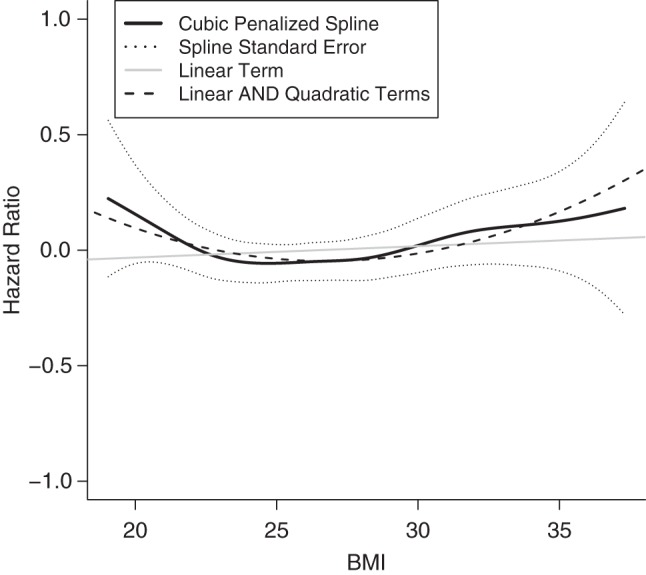
Figure 1.

Plot of logarithm of the hazard ratio for atrial fibrillation versus body mass index (BMI), Cardiovascular Health Study, 1989–2008. The y-axis gives the logarithm of the hazard ratio; the x-axis gives BMI as weight in kilograms divided by height in meters squared. The plot shows the unadjusted linear term, linear and quadratic terms, and penalized cubic spline for BMI.
