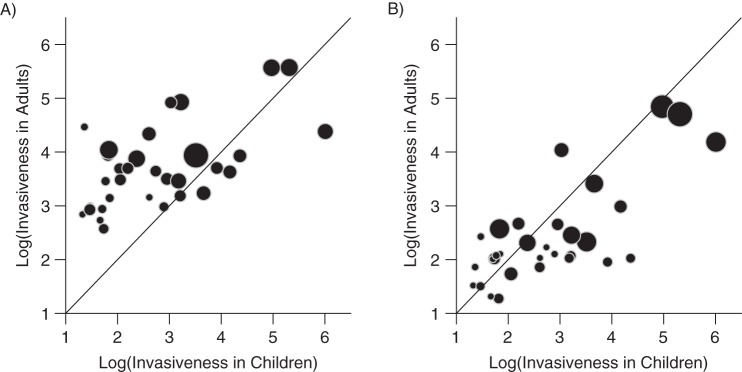
Figure 2.
Comparison of invasiveness patterns (incidence of disease divided by frequency of carriage) in children younger than 7 years of age and those in A) adults 18–39 years of age or B) adults 40 years of age or older, Navajo and White Mountain Apache populations, United States, 1995–2012. The size of the bubble is proportional to the precision of the estimates (i.e., larger bubbles indicate more confidence). The diagonal line denotes X = Y. For serotype labels, see Web Figure 2.

