
Figure 7.
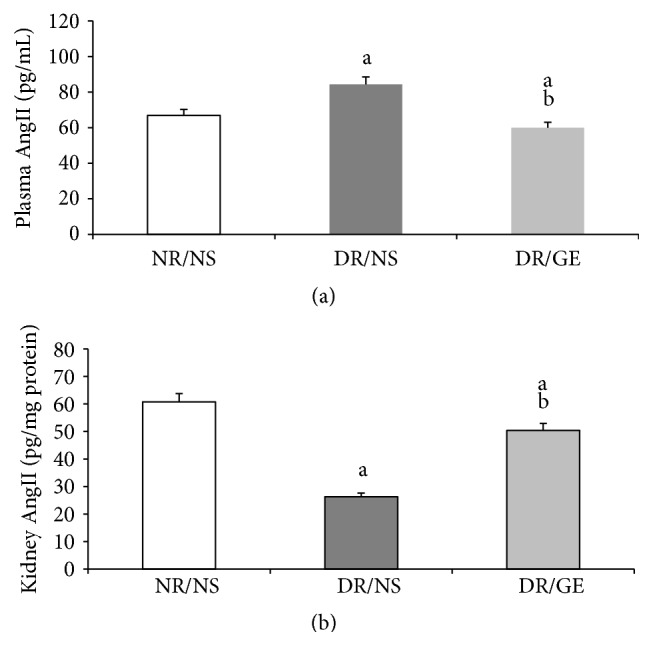
GE treatment decreased plasma AngII and increased kidney AngII in diabetic rats. AngII was quantitated in both (a) plasma (pg/mL) and (b) kidney (pg/mg) at the end of the treatment period (week 8). NR/NS: normal rats/normal saline treated; DR/NS: diabetic rats/normal saline treated; DR/GE: diabetic rats/garlic extract treated; asignificantly different compared to NR/NS; bsignificantly different compared to DR/NS.