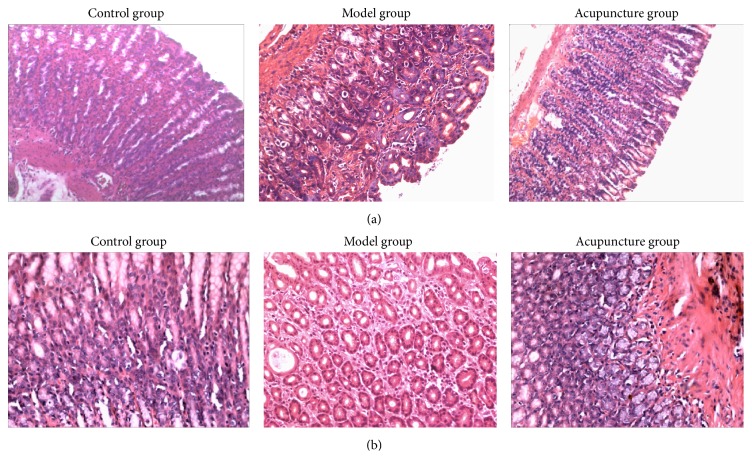
Figure 2.
Histological evaluation of gastric glands in rats. (a) H&E (×100) staining of gastric glands. Rats in the control group showed complete glandular structure (left diagram). Rats in the model group showed irregular arrangement and reduction of gastric glands with atrophic gastritis (middle). Rats in the acupuncture group showed regular arrangement and increase of gastric glands after acupuncture treatment (right diagram). (b) H&E (×200) staining of gastric glands. Rats in the model group showed cystic dilation and neutrophils and lymphocytes infiltrated into gastric glands with atrophic gastritis (middle). Rats in the acupuncture group showed an increased number of gastric glands and inflammatory cells were reduced (right diagram).

