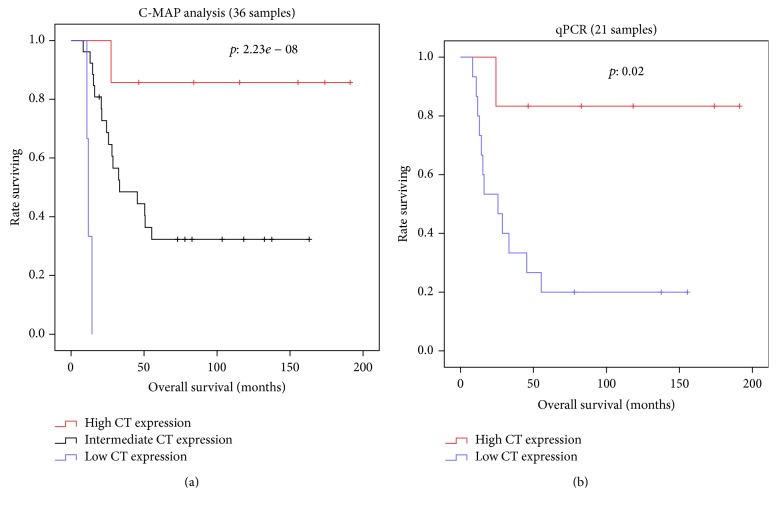
Figure 3.
Overall survival curves stratifying the patients according to integrated cancer testis antigen genes expression. As CTA genes are coexpressed, we performed a principal component analysis (PCA) of the genes to stratify the patients into low/intermediate and high expression based on first principal component (PC1) values. (a) PC1 was determined in 35 melanoma lines based on all 51 probe sets from CTA genes in the C-MAP array. (b) PC1 was determined in 21 melanoma lines based on qPCR data generated for CTAs MAGE-A1, SSX1, SSX4, and NY-ESO-1 (CTAG1B).

