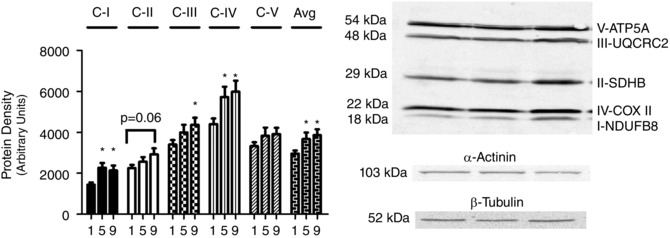
Figure 4. Human skeletal muscle protein content of mitochondrial electron transport system proteins (subunits of complexes I–V) throughout nine sessions of high‐intensity interval exercise .

α‐Actinin and β‐tubulin were used as loading controls as described in the Methods section. Results are shown as means + SEM; n = 11; *P < 0.05 compared with T1. Avg is the average of all 5 complex protein densities.
