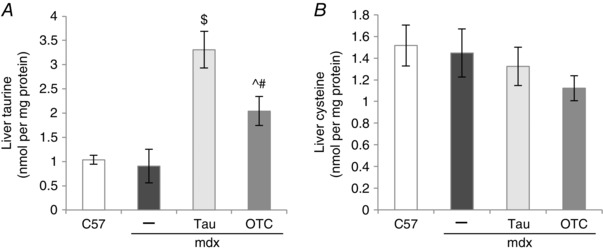
Figure 2. Liver content of taurine (A) and cysteine (B) in untreated C57, untreated mdx, taurine‐treated mdx and OTC‐treated mdx mice .

Symbols for significant differences (P < 0.05) are: $between untreated mdx and taurine‐treated mdx, ^between untreated mdx and OTC‐treated mdx, #between OTC‐ and taurine‐treated mdx. Data are presented as mean ± SEM and n = C57 (10), mdx (6), taurine (8) and OTC (8) treated mice.
