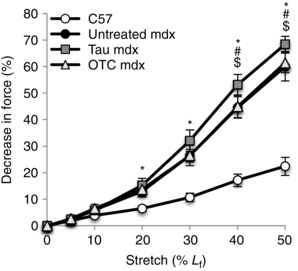
Figure 6. Stretch‐induced damage in untreated C57, untreated mdx, taurine‐treated mdx and OTC‐treated mdx EDL muscle .

The decrease in maximum force production is plotted following a series of eccentric contractions of increasing amplitude (stretch applied as a % of the optimal fibre length, L f). Symbols for significant differences (P < 0.05) are: *between untreated mdx and C57, $between untreated mdx and taurine‐treated mdx, #between OTC‐ and taurine‐treated mdx. Data are presented as mean ± SEM and n = C57 (10), mdx (6), taurine (8) and OTC (8) treated mice. Data were analysed by two‐way repeated measures ANOVA.
