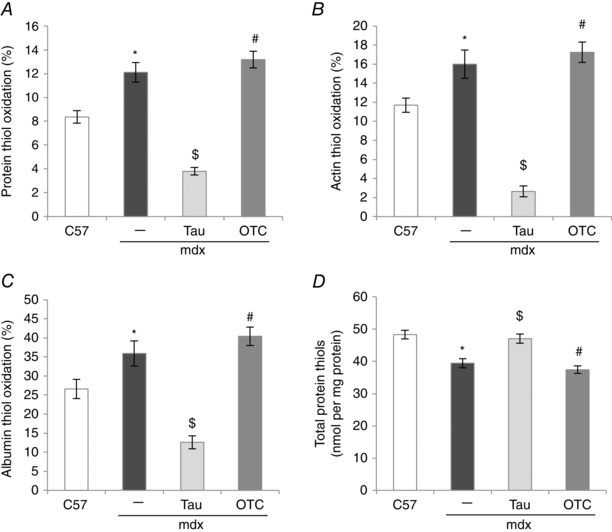
Figure 8. Percentage of protein thiol oxidation (A), thiol oxidation of actin (B) and albumin (C), and total protein thiols (D) in untreated C57, untreated mdx, taurine‐treated mdx and OTC‐treated mdx EDL muscle .

Symbols for significant differences (P < 0.05) are: *between untreated mdx and C57, $between untreated mdx and taurine‐treated mdx, #between OTC‐ and taurine‐treated mdx. Data are presented as mean ± SEM and n = C57 (10), mdx (6), taurine (8) and OTC (8) treated mice.
