
Figure 1. Variability of breathing frequency and respiratory pattern following SH and minocycline treatment .
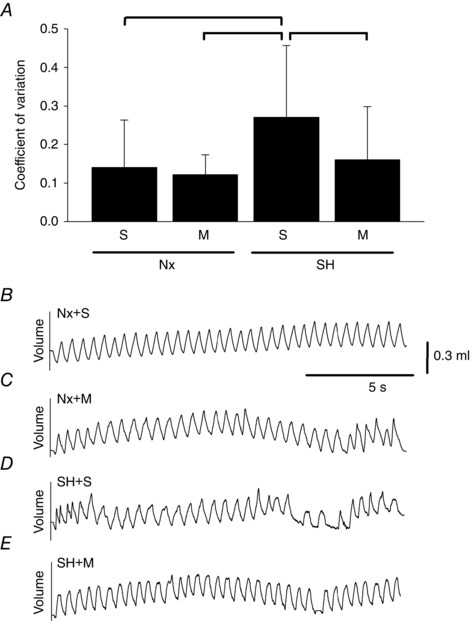
Values for the coefficient of variation (A) and representative respiratory traces (B–E) of P16 rats breathing room air after being raised in normoxia (Nx) or exposed to SH between P11 and P15, and treated with minocycline (M) or saline (S; control). Values in A are means ± SD; P < 0.05.