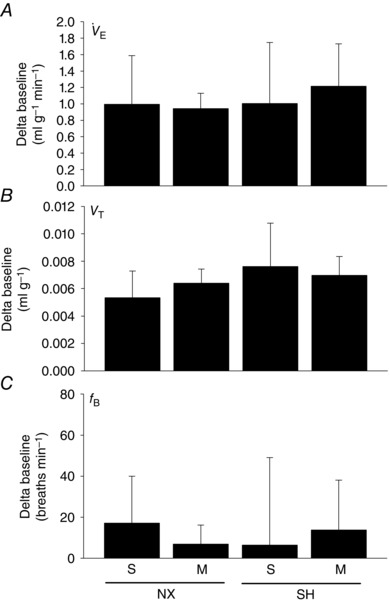
Figure 3. Hypercapnic ventilatory responses following SH and minocycline treatment .

Ventilation (A; ), tidal volume (B; V T) and breathing frequency (C; f B) of P16 rats during acute hypercapnia (5% CO2, 5 min) after being raised in normoxia (NX) or exposed to SH between P11 and P15, and treated with minocycline (M) or saline (S; control). Values are means ± SD and expressed as a delta baseline; P < 0.05.
