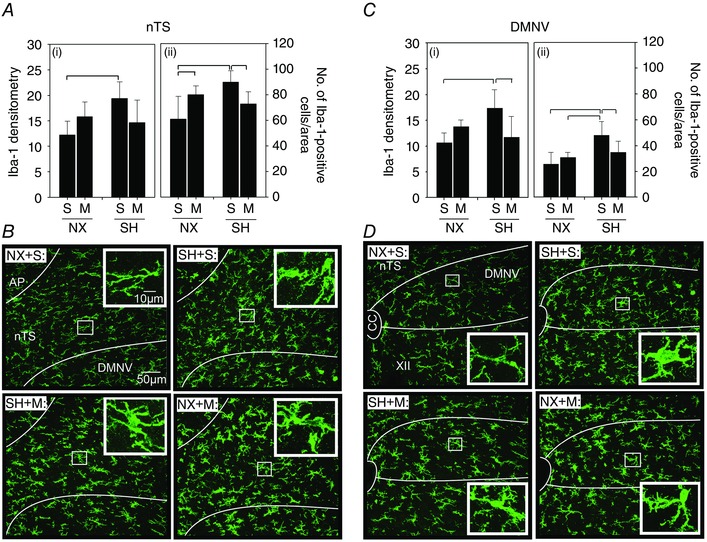
Figure 4. Microglia (Iba‐1) expression in the nTS and DMNV following SH and minocycline treatment .

Changes in expression of the microglia marker Iba‐1 in the (A) nTS and (C) DMNV of P16 rats after being raised in normoxia (NX) or exposed to SH between P11 and P15, and treated with minocycline (M) or saline (S; control). Representative images of the (B) nTS and (D) DMNV of rats from each treatment group are also provided. Iba‐1 expression was assessed via fluorescence densitometry (i) and by the number of Iba‐1‐positive cells per AOI (ii). Note the increased Iba‐1 expression in the nTS and the DMNV following SH compared to control rats, which was prevented by minocycline treatment. Inset: higher magnification of microglia within each representative treatment group for nTS and DMNV. A low‐magnification image to illustrate orientation of the nTS and DMNV is provided in Fig. 6 C. Values are means ± SD; P < 0.05.
