
Figure 4. TPC2 and TPC1/2 downregulation increases LC3II in neonatal rat cardiomyocytes .
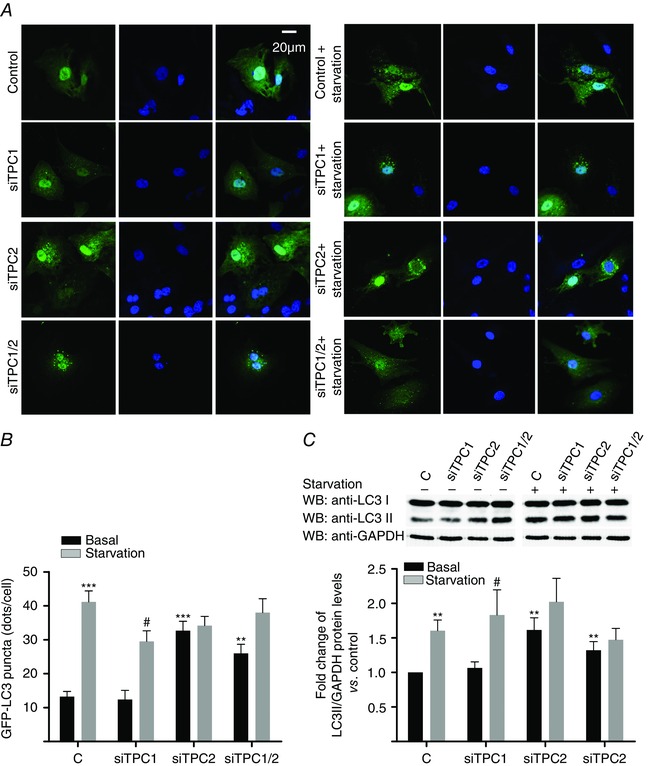
A and B, immunocytochemistry/confocal analysis showed that downregulation of TPC2 and TPC1/2 (but not of TPC1) increases basal GFP‐LC3 (n = 4). C, immunoblotting confirmed these results for LC3II/GAPDH ratio (n = 5). Bar graphs show the mean ± SEM. Statistical significance (Mann–Whitney U test): *P ≤ 0.05 vs. basal control; **P ≤ 0.01 vs. basal control; ***P ≤ 0.001 vs. basal control; # P ≤ 0.05 vs. non‐starved siTPC1.