
Figure 1. Scheme for key steps in activation of glucose transport during exercise in skeletal muscle .
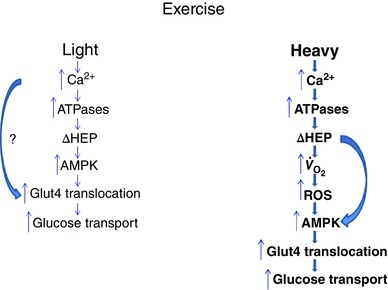
Light and Heavy denote exercise intensity. Bold lettering and bold arrows denote greater activities/levels (in Heavy). ΔHEP, change in levels of high energy phosphates (decreases in phosphocreatine and ATP and increases in ADP and AMP); AMPK, AMP‐activated protein kinase; , oxygen uptake. Curved arrow in Light denotes a Ca2+‐dependent enhancement of Glut4 translocation via an unknown mechanism(s) (denoted by ?) in addition to a low degree of activation of AMPK. Curved arrow in Heavy denotes AMP‐mediated activation of AMPK. The figure is partially derived from Katz (2007).