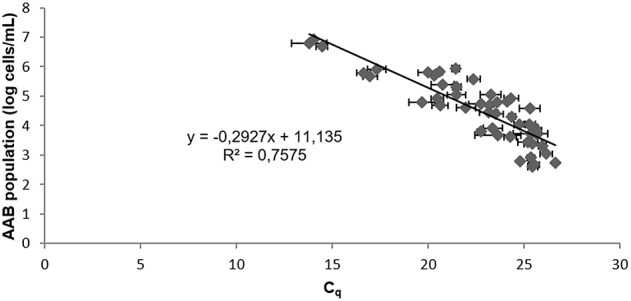
Figure 2.

Standard curve from 10-fold serial sample dilutions of red wines containing A. aceti, A. pasteurianus, G. oxydans, Ga. liquefaciens, and the AAB mixture. The Cq values are the average of three individual experiments performed in triplicate. Error bars represent standard deviations.
