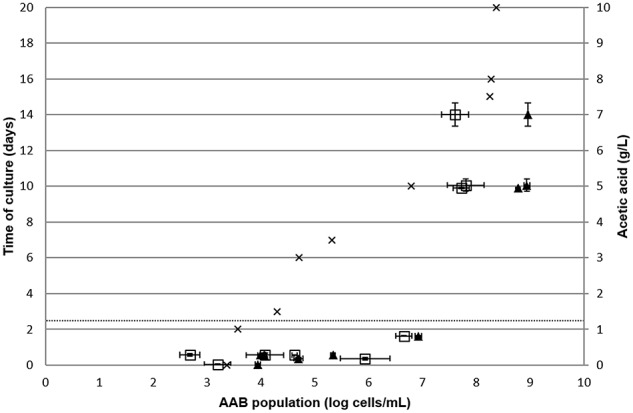
Figure 4.

Monitoring of natural AAB growth in red wine. The AAB population was determined by FCM ( ) and qPCR (▴) in duplicate over time. Acetic acid concentration was determined in duplicated over time. The dotted line represents the limit of the European threshold. Error bars represent standard deviations.
