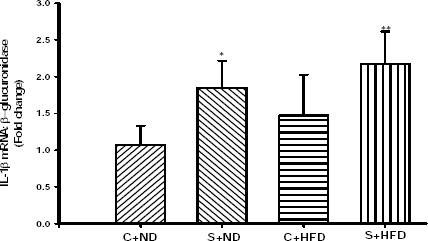
Figure 2.

Expression level of IL-1β mRNA in the tracheal tissue of experimental groups. Values are depicted as mean±SD. C+ND; control with normal diet, S+ND; OVA-sensitized with normal diet, C+HFD; control with high-fat diet, S+HFD; OVA-sensitized with high-fat diet. Statistical differences between the control and other groups; *; P<0.05, **; P<0.01. For each group, n=5
