
Figure 3.
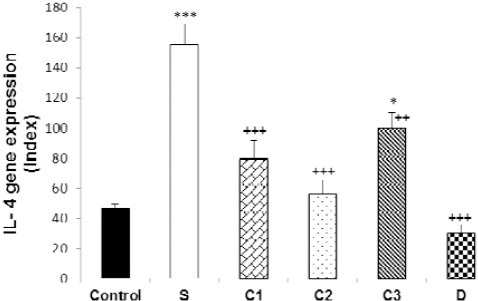
Values (mean±SEM) of IL-4 gene expression in splenocytes from control mice (control) and sensitized animals (S), and S groups treated with dexamethasone (D) and carvacrol at 3 concentrations of 75, 150, and 300 µg/ml (C1, C2, and C3, respectively), (n=5 for groups C, S, and D, and n=6 for groups treated with carvacrol). The levels of gene expression were gene fold/ml but presented as Normalized Index as explained in the methods section. Significant difference between control and other groups: *P<0.05, ***P<0.001. Significant difference between dexamethasone and carvacrol vs sensitized group: ++P<0.01, +++P<0.001. The statistical comparisons were made using ANOVA with Tukey–Kramer multiple post hoc test