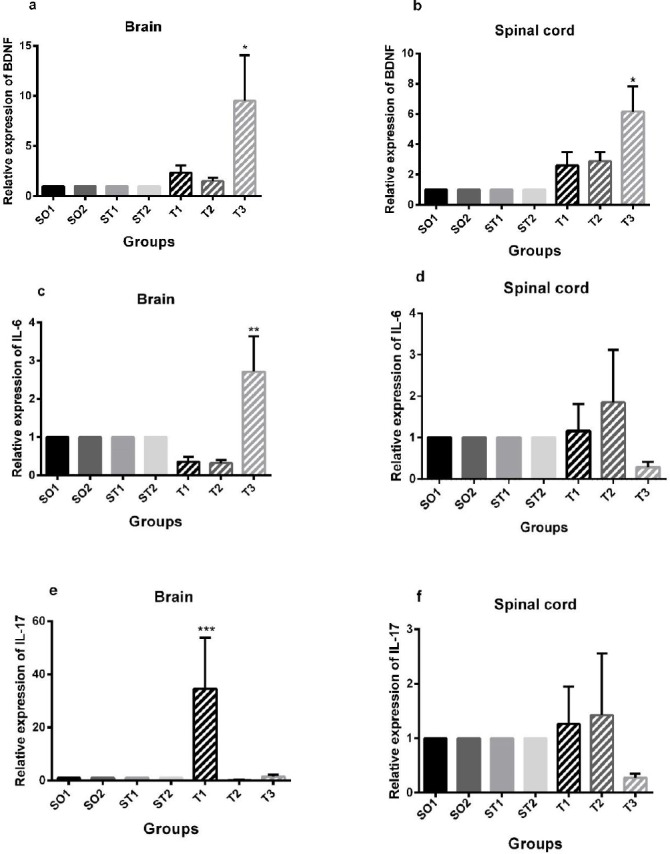
Figure 1.

Real-time PCR results of relative expression of brain-derived neurotrophic factor (BDNF), interleukin-6 (IL-6), and interleukin-17A (IL-17A) mRNA in the brain and spinal cord. (a) (c) Animals in the T3 group showed significantly increased relative expression of BDNF and IL-6 in the brain compared to sham operated, sham-treated, and treatment groups (*P<0.01, **P<0.01). (e) Experimental autoimmune encephalomyelitis (EAE) mice in the T1 group showed significantly increased relative expression of IL-17A in the brain compared to sham operated, sham-treated, and treatment groups (***P<0.01). (b) Animals in the T3 group showed significantly increased relative expression of BDNF in the spinal cord compared to sham operated, sham-treated, and treatment groups (*P<0.01). Data are given as mean ± SEM analyzed by one-way ANOVA and LSD’s post hoc test. SO1 (sham operated 1, sham +PBS); SO2 (sham operated 2, sham+ PBS+ riboflavin); ST1 (sham treatment 1, EAE+ Veh1); ST2 (sham treatment 2, EAE +Veh2); T1 (treatment 1, EAE + INFβ-1a); T2 (treatment 2, EAE +riboflavin); T3 (treatment 3, EAE + INFβ-1a + riboflavin); BDNF (brain-derived neurotrophic factor). The experiments were repeated three times in duplicates. (n = 8 for all groups)
