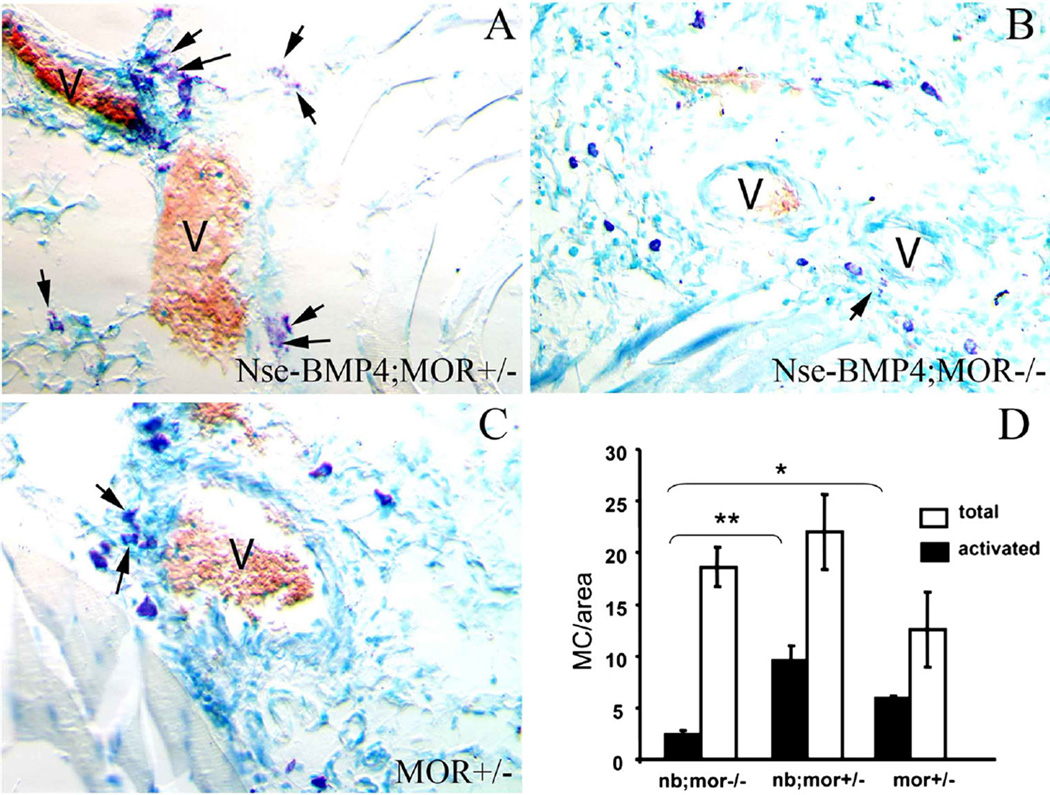
Fig. 4.
MC activation/degranulation is MOR dependent. Typical images of toluidine blue staining of sections from injured hind limbs from Nse-BMP4;MOR+/− (a), Nse-BMP4;MOR−/− (b) and MOR+/− mice (c), show the number, location, size and the characteristic morphology of the metachromatic stained (red–purple) MCs. Light blue is the orthochromatic staining of the background, and red blood cells are brown. Note that the MCs in different groups are clearly different in both size and morphology. MCs in Nse-BMP4;MOR−/− mice are much smaller (immature) than in other groups. Also note that degranulation of MCs in Nse-BMP4;MOR−/− mice is less obvious than in Nse-BMP4;MOR+/− mice, which have the highest number (or percentage) of activated MCs. d Quantification of total numbers and the activated/degranulated MCs in different groups. Error bars are SD, *P < 0.05, **P < 0.01 vs. control

