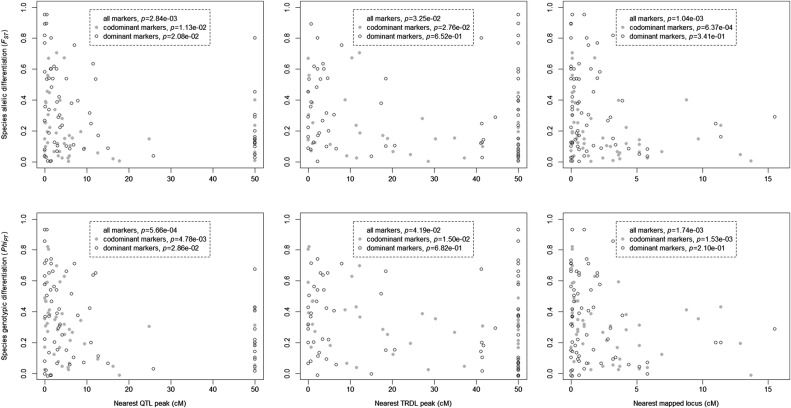
Figure 2.
Relationships between genetic differentiation and genetic map distance to the nearest QTL peak, the nearest TRDL or the nearest mapped marker. Presented P values summarize Spearman rank correlation tests. All significant associations were negative. Sample sizes were 48 codominant loci and 63 dominant loci. Loci on linkage groups without a QTL or TRDL peak were assigned an unlinked genetic map distance of 50 cM.

